Compliance
mcpgate's compliance surface is four layers stacked on the same audit trail. Each one answers a different question — what flowed through, what got redacted, when a lot suddenly left, and what was blocked before it ever happened.
The compliance surface, end to end
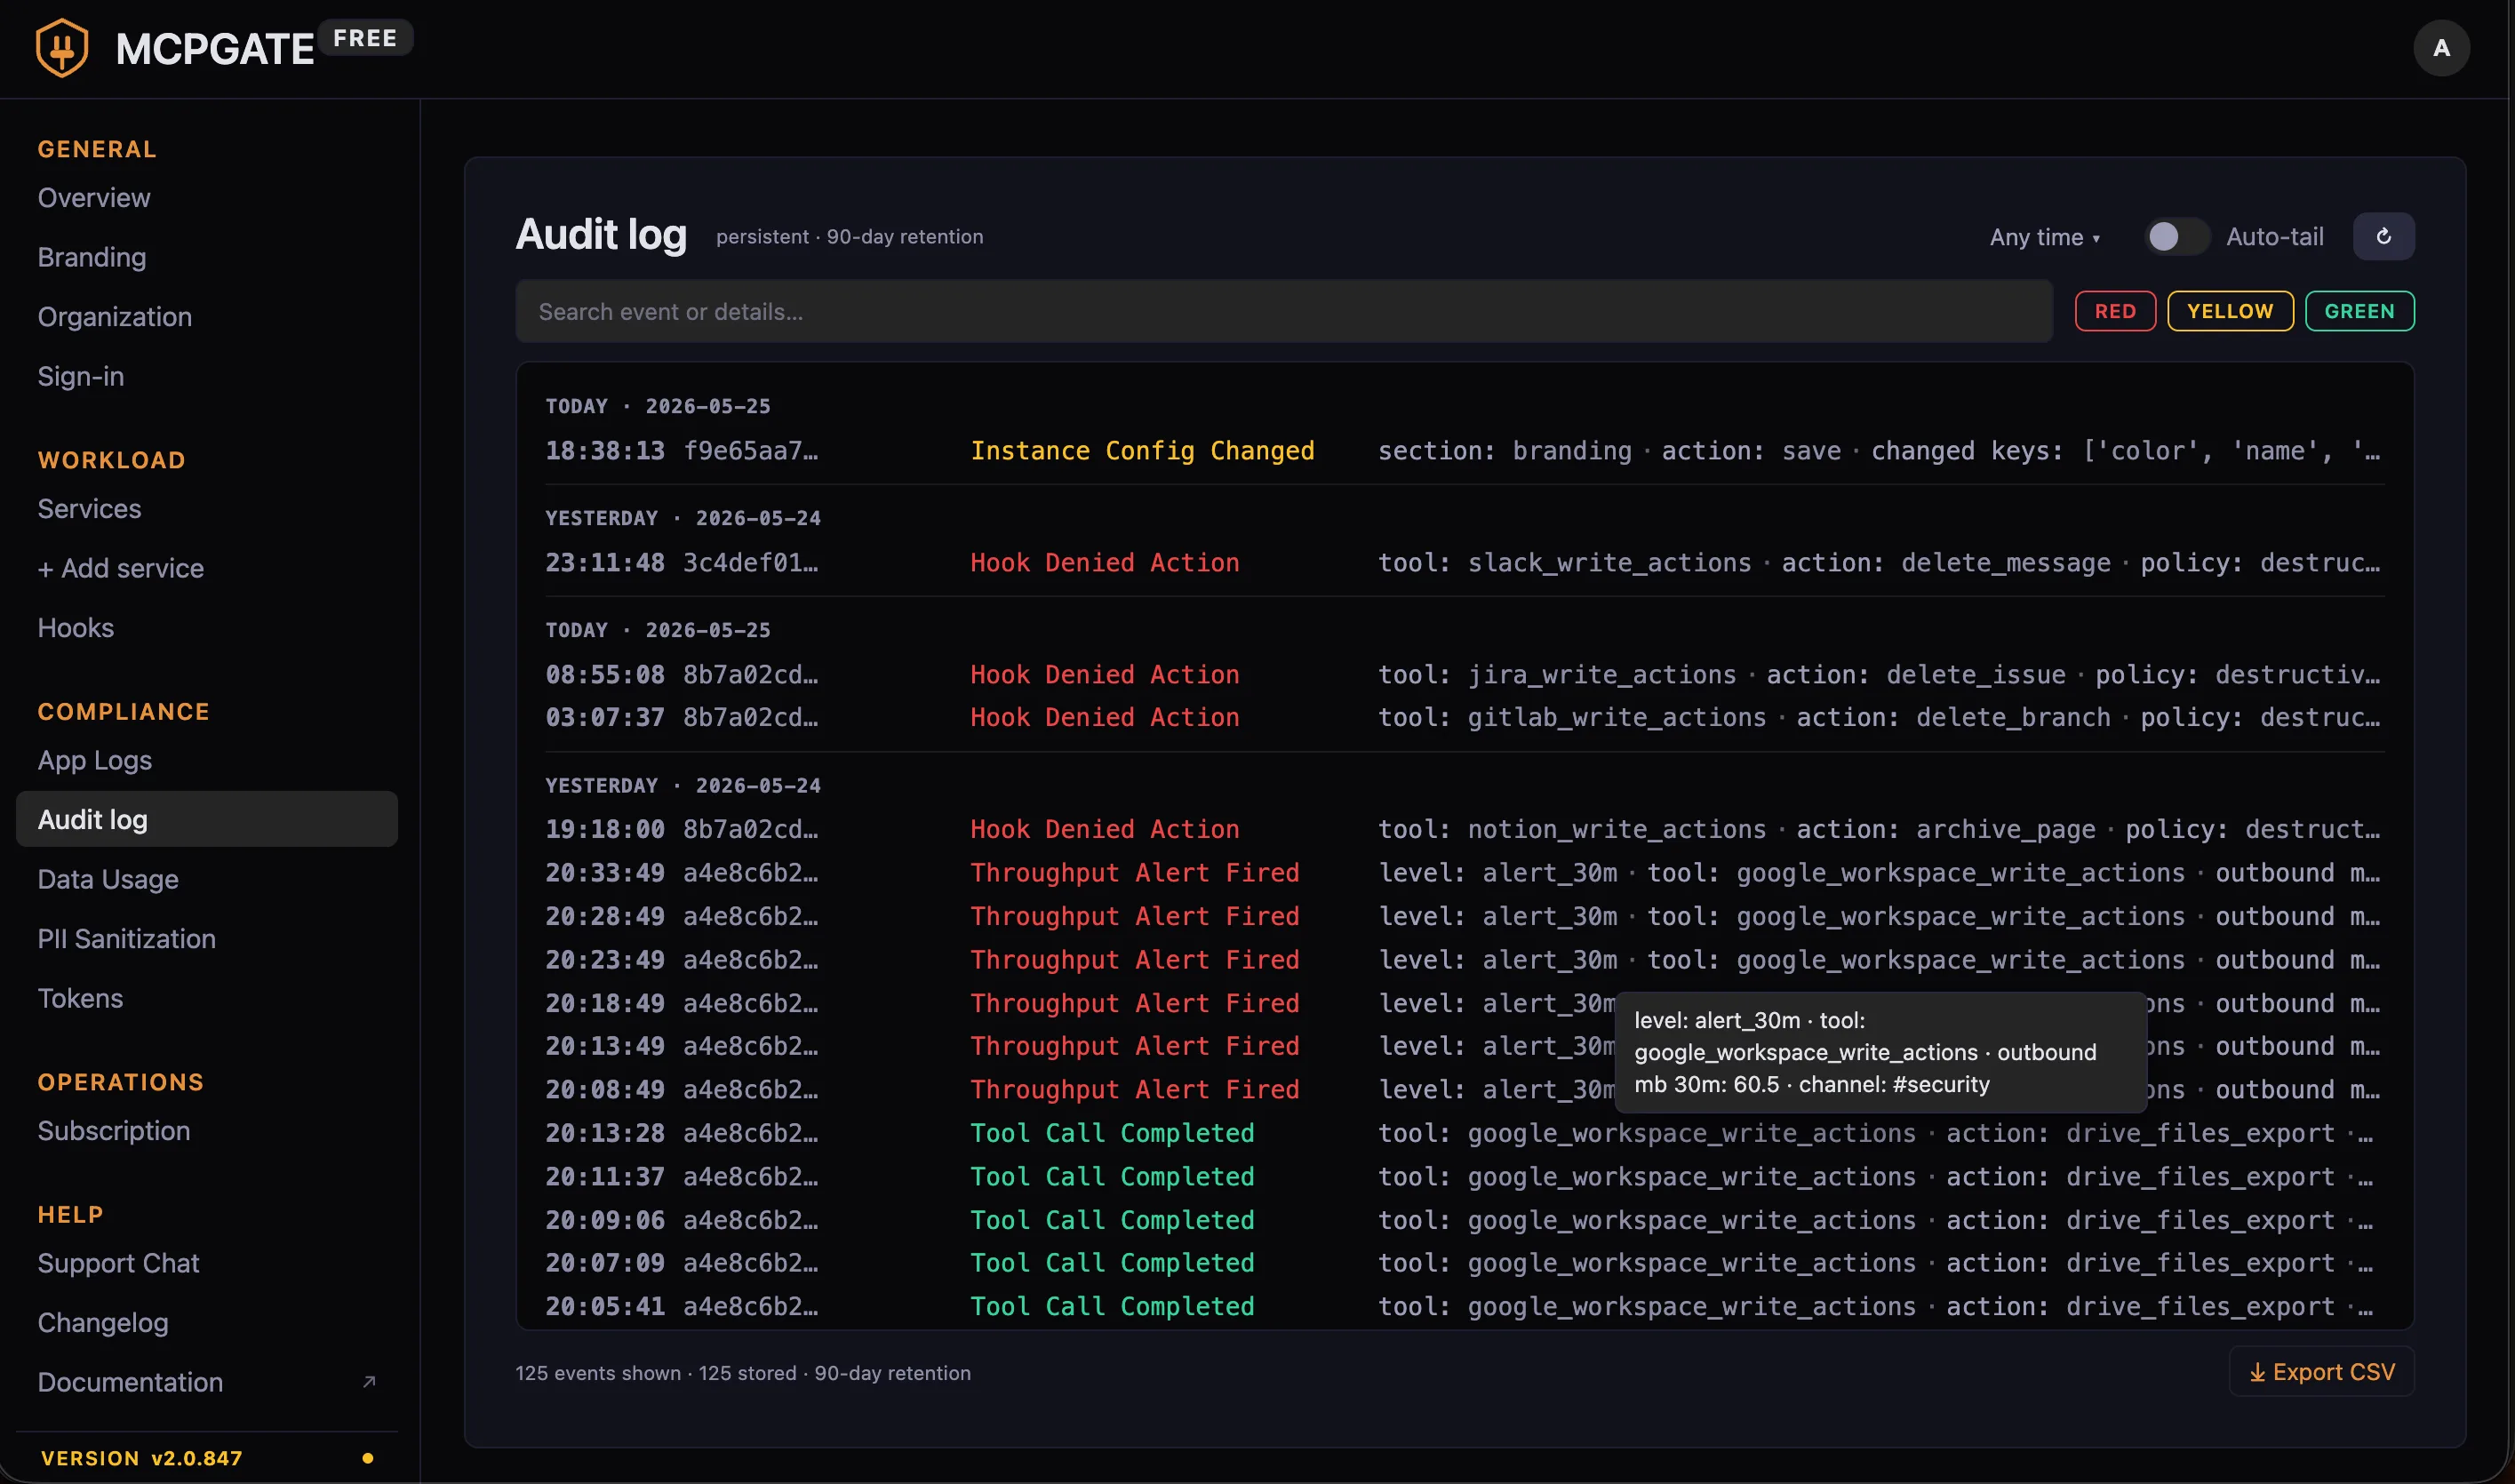
1. Audit log
Every action that touches the gateway appends a row to the audit log: which actor (pseudonymized user ID), which service, which action, request and response byte counts, the result code, and the timestamp. No PII — the audit log uses the same pseudonym layer the LLM does, so even an exfiltrated audit dump does not reveal real names or emails.
Where it lives: Admin Panel → Audit log. Filterable by actor, service, action, time window, and result.
Retention: Configurable via the Data Usage page (defaults to 90 days, can be extended to multi-year for regulated industries).
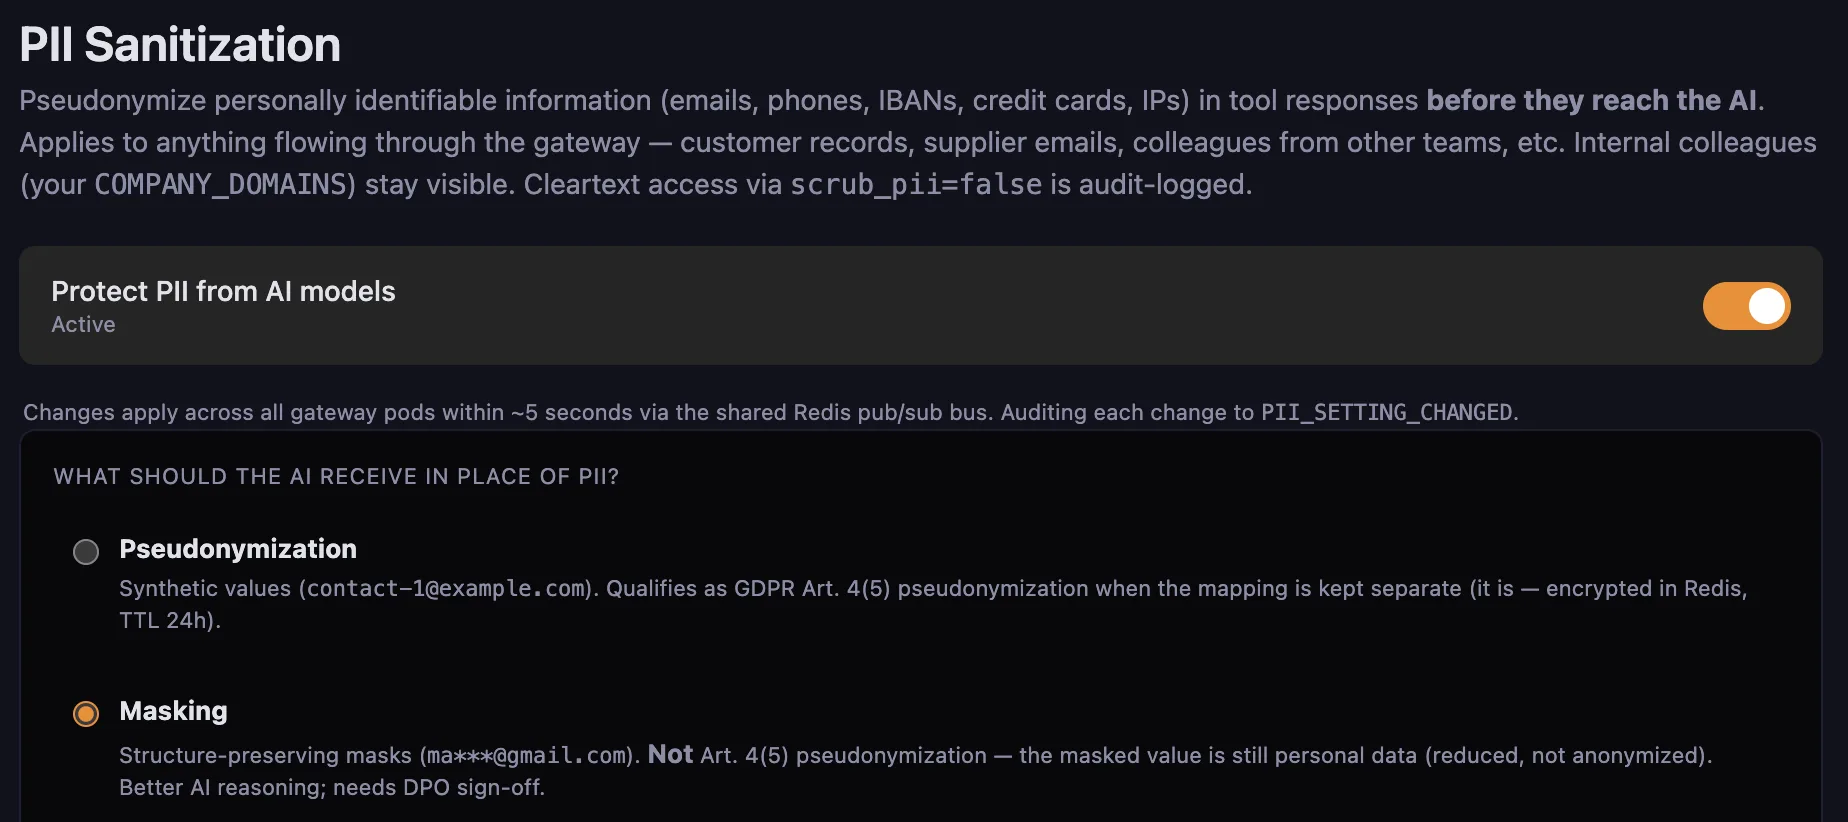
2. PII sanitization
Before any payload reaches the LLM, the sanitizer pseudonymizes emails, names, phone numbers, and configurable custom patterns. The replacement map is encrypted (AES-GCM) and stored with a 24-hour TTL by default. On the way back, the upstream tool call receives the real values — the LLM never sees them.
Where it lives: Admin Panel → Compliance → PII Sanitization. The built-in pattern set covers emails, phones, IBANs, credit cards, and IPs. The page also exposes the master toggle ("Protect PII from AI models") and the substitution-strategy choice — Pseudonymization (GDPR Art. 4(5)-aligned, encrypted Redis mapping with 24h TTL) or Masking (structure-preserving, like ma***@gmail.com; reads better for the LLM but is reduced personal data, not anonymized — needs DPO sign-off). Future iterations will extend to per-field policies and per-user opt-outs.
Audit interaction: Each PII post-hook invocation persists a decision row in the audit DB (which fields matched, how many, whether they were redacted or allowed through). That decision row is the forensic record if you ever need to prove what the LLM did or did not see.
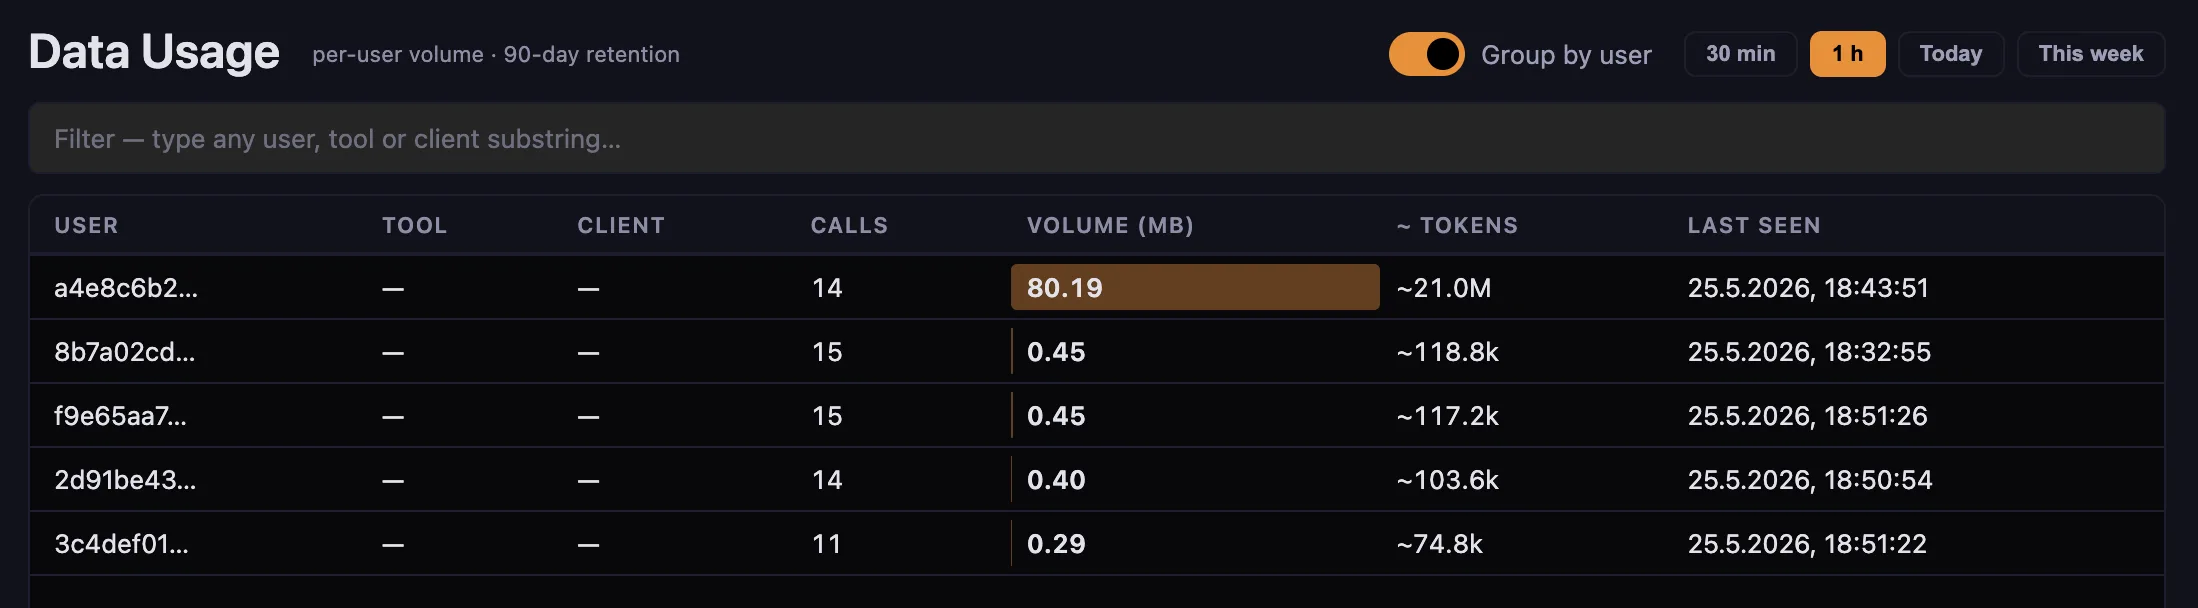
3. Throughput as a DLP lens
The Throughput dashboard reads the same audit log, but groups by actor and time window — so a sudden 50 MB outbound spike at 3 am from one user is one row at the top of the page, not a needle in a 50,000-line haystack.
This is what makes Throughput a compliance feature, not just an ops metric. The design intent is data-exfiltration detection. The fact that an admin can also see "who is the heavy user this month" is a side-effect, not the purpose.
What it surfaces:
- Per-user inbound and outbound byte volume, rolled up to hour / day / week
- Per-service breakdown — was the volume in Drive downloads, Gmail attachments, BigQuery exports?
- Anomaly markers when a user crosses a configurable threshold
Where it lives: Admin Panel → Throughput. The page shipped in v2.0.819, with persistence moved from Redis to the audit DB in v2.0.822 (so the data survives a Redis flap).
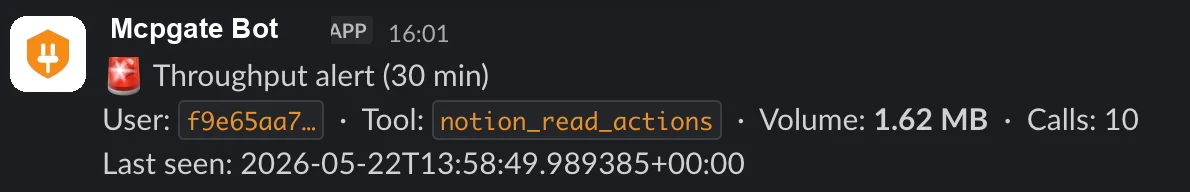
4. Slack alerts on threshold breach
Real-time DLP is the difference between "we noticed something Tuesday" and "the security team got a Slack ping at 3:07 am." Configure a threshold per user, per service, or org-wide, and a breach posts to the configured Slack channel with a deep-link back to the audit row.
Where it lives: Admin Panel → Throughput → Threshold settings. The threshold-editor modal accepts sub-MB values (since v2.0.830), so you can alert on small but unusual volumes (a single 200 KB Slack DM with a CSV attachment, say).
5. Policy hooks — the prevention layer
Audit tells you what happened. Hooks decide what is allowed to happen. They run before dispatch and can deny, enrich, or route based on the actor, the action, the payload, or any combination.
Two-layer scope: company-wide hooks live in config/tool_hooks.yaml and apply to everyone. Per-user hooks can override or extend them with per-actor logic. Both reload on file change — no restart needed.
Common patterns:
- Deny destructive actions from a specific group of users (read-only research interns can
list_issuesbut notdelete_project) - Require
confirmed=truefor any action that matches a destructive-verb path keyword (/delete,/revoke,/terminate) - Admin-approval gate for the catastrophic class — beyond per-call confirmation, the eight risk categories (permanent delete, container destroy, bulk delete, generic API passthrough …) are stopped at the gateway until an admin enables them. See destructive-action governance.
- Auto-enrich Jira issue descriptions with project templates, add Slack-thread back-links, convert Markdown to ADF
- Block based on PII match — if the outbound payload contains a customer email not in the allowlist, deny before dispatch
Where it lives: Reference at /docs/hooks/. The Admin Panel → Hooks page lists which hooks are active and which fired recently.
Where each surface lives in the Admin Panel
| Surface | Admin Panel section | Shipped in |
|---|---|---|
| Overview dashboard (live KPIs + alert deep-links) | Overview | v2.0.832 |
| Audit log | Audit | baseline |
| PII sanitization config | Compliance → PII | baseline |
| Throughput dashboard | Throughput | v2.0.819 |
| Threshold & Slack alerts | Throughput → Thresholds | v2.0.820 |
| Policy hooks | Hooks | baseline |
| Data Usage retention & storage limits | Compliance → Data Usage | v2.0.826 |
Configuration reference
Audit retention
audit:
  retention_days: 90            # default; regulated industries set 730+
  redact_payload: true      # keep byte size, drop payload itself
PII sanitization
pii:
  patterns:
    - email
    - phone
    - person_name
  custom_regex:
    - name: "customer_id"
      pattern: "^CUS-[0-9]{6}$"
  map_ttl_hours: 24
Throughput thresholds
throughput:
  alerts:
    - scope: per_user
      window: "1h"
      outbound_mb: 50
      notify_slack: "#security"
Where alerts go when something fires
The compliance surface raises alerts in two places. Throughput threshold breaches post to a chosen Slack channel through the throughput page’s own delivery path (configured above). OAuth refresh failures — and, deliberately, future event classes — flow through the unified Notifications dispatcher: Slack DM → Microsoft Teams bot → SMTP email, all over your own infrastructure. Setup and the full delivery model live on that page.
Related
- Action Usage — which actions agents actually call, ranked, with audit-log drill-down on failures
- Notifications — the operator-alert dispatcher (Slack DM / Teams / Email fallback chain)
- Access Model — roles, permissions, audit, and the RBAC questions answered honestly
- Dynamic action discovery isn’t novel. Doing it safely is. — the risk-tagged action model that complements the policy-hooks layer
- Hooks reference — full hook configuration syntax and the built-in hook catalog
- Configuration reference — the rest of the gateway’s YAML